Graph Sampling Project
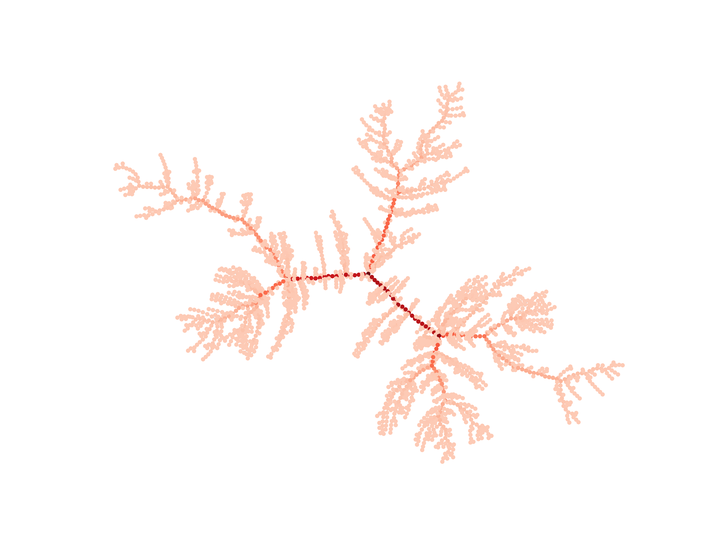
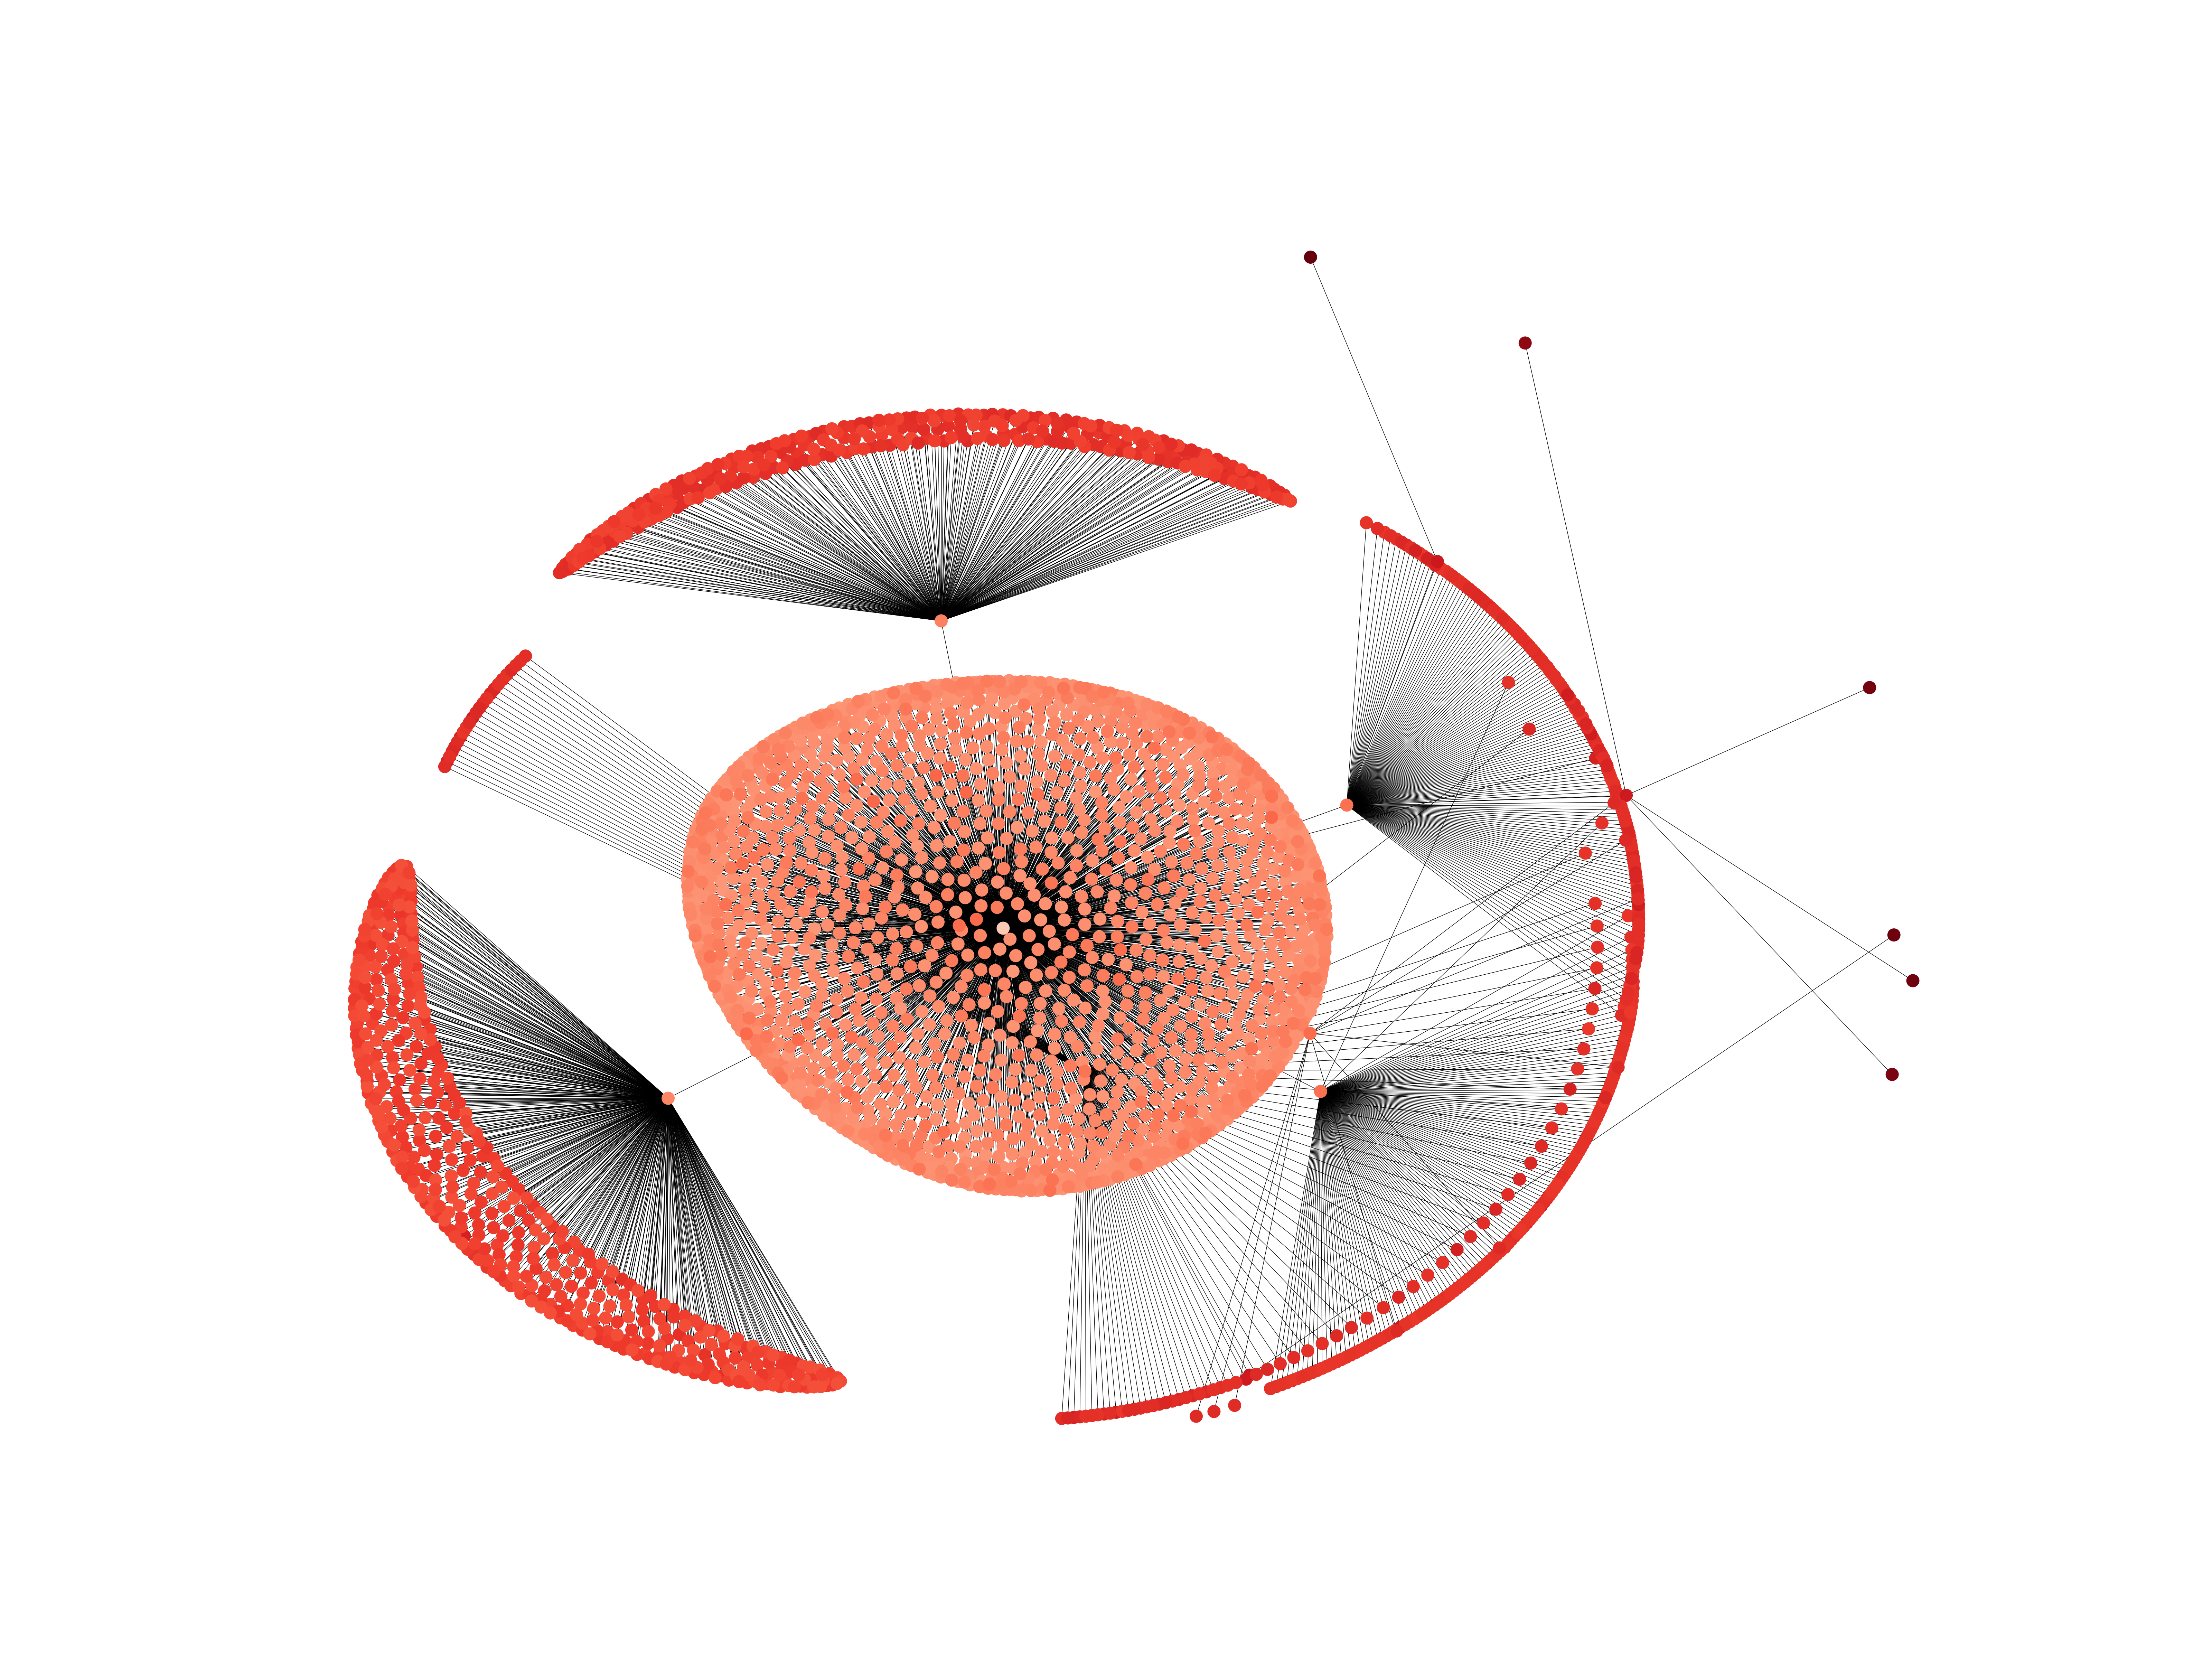
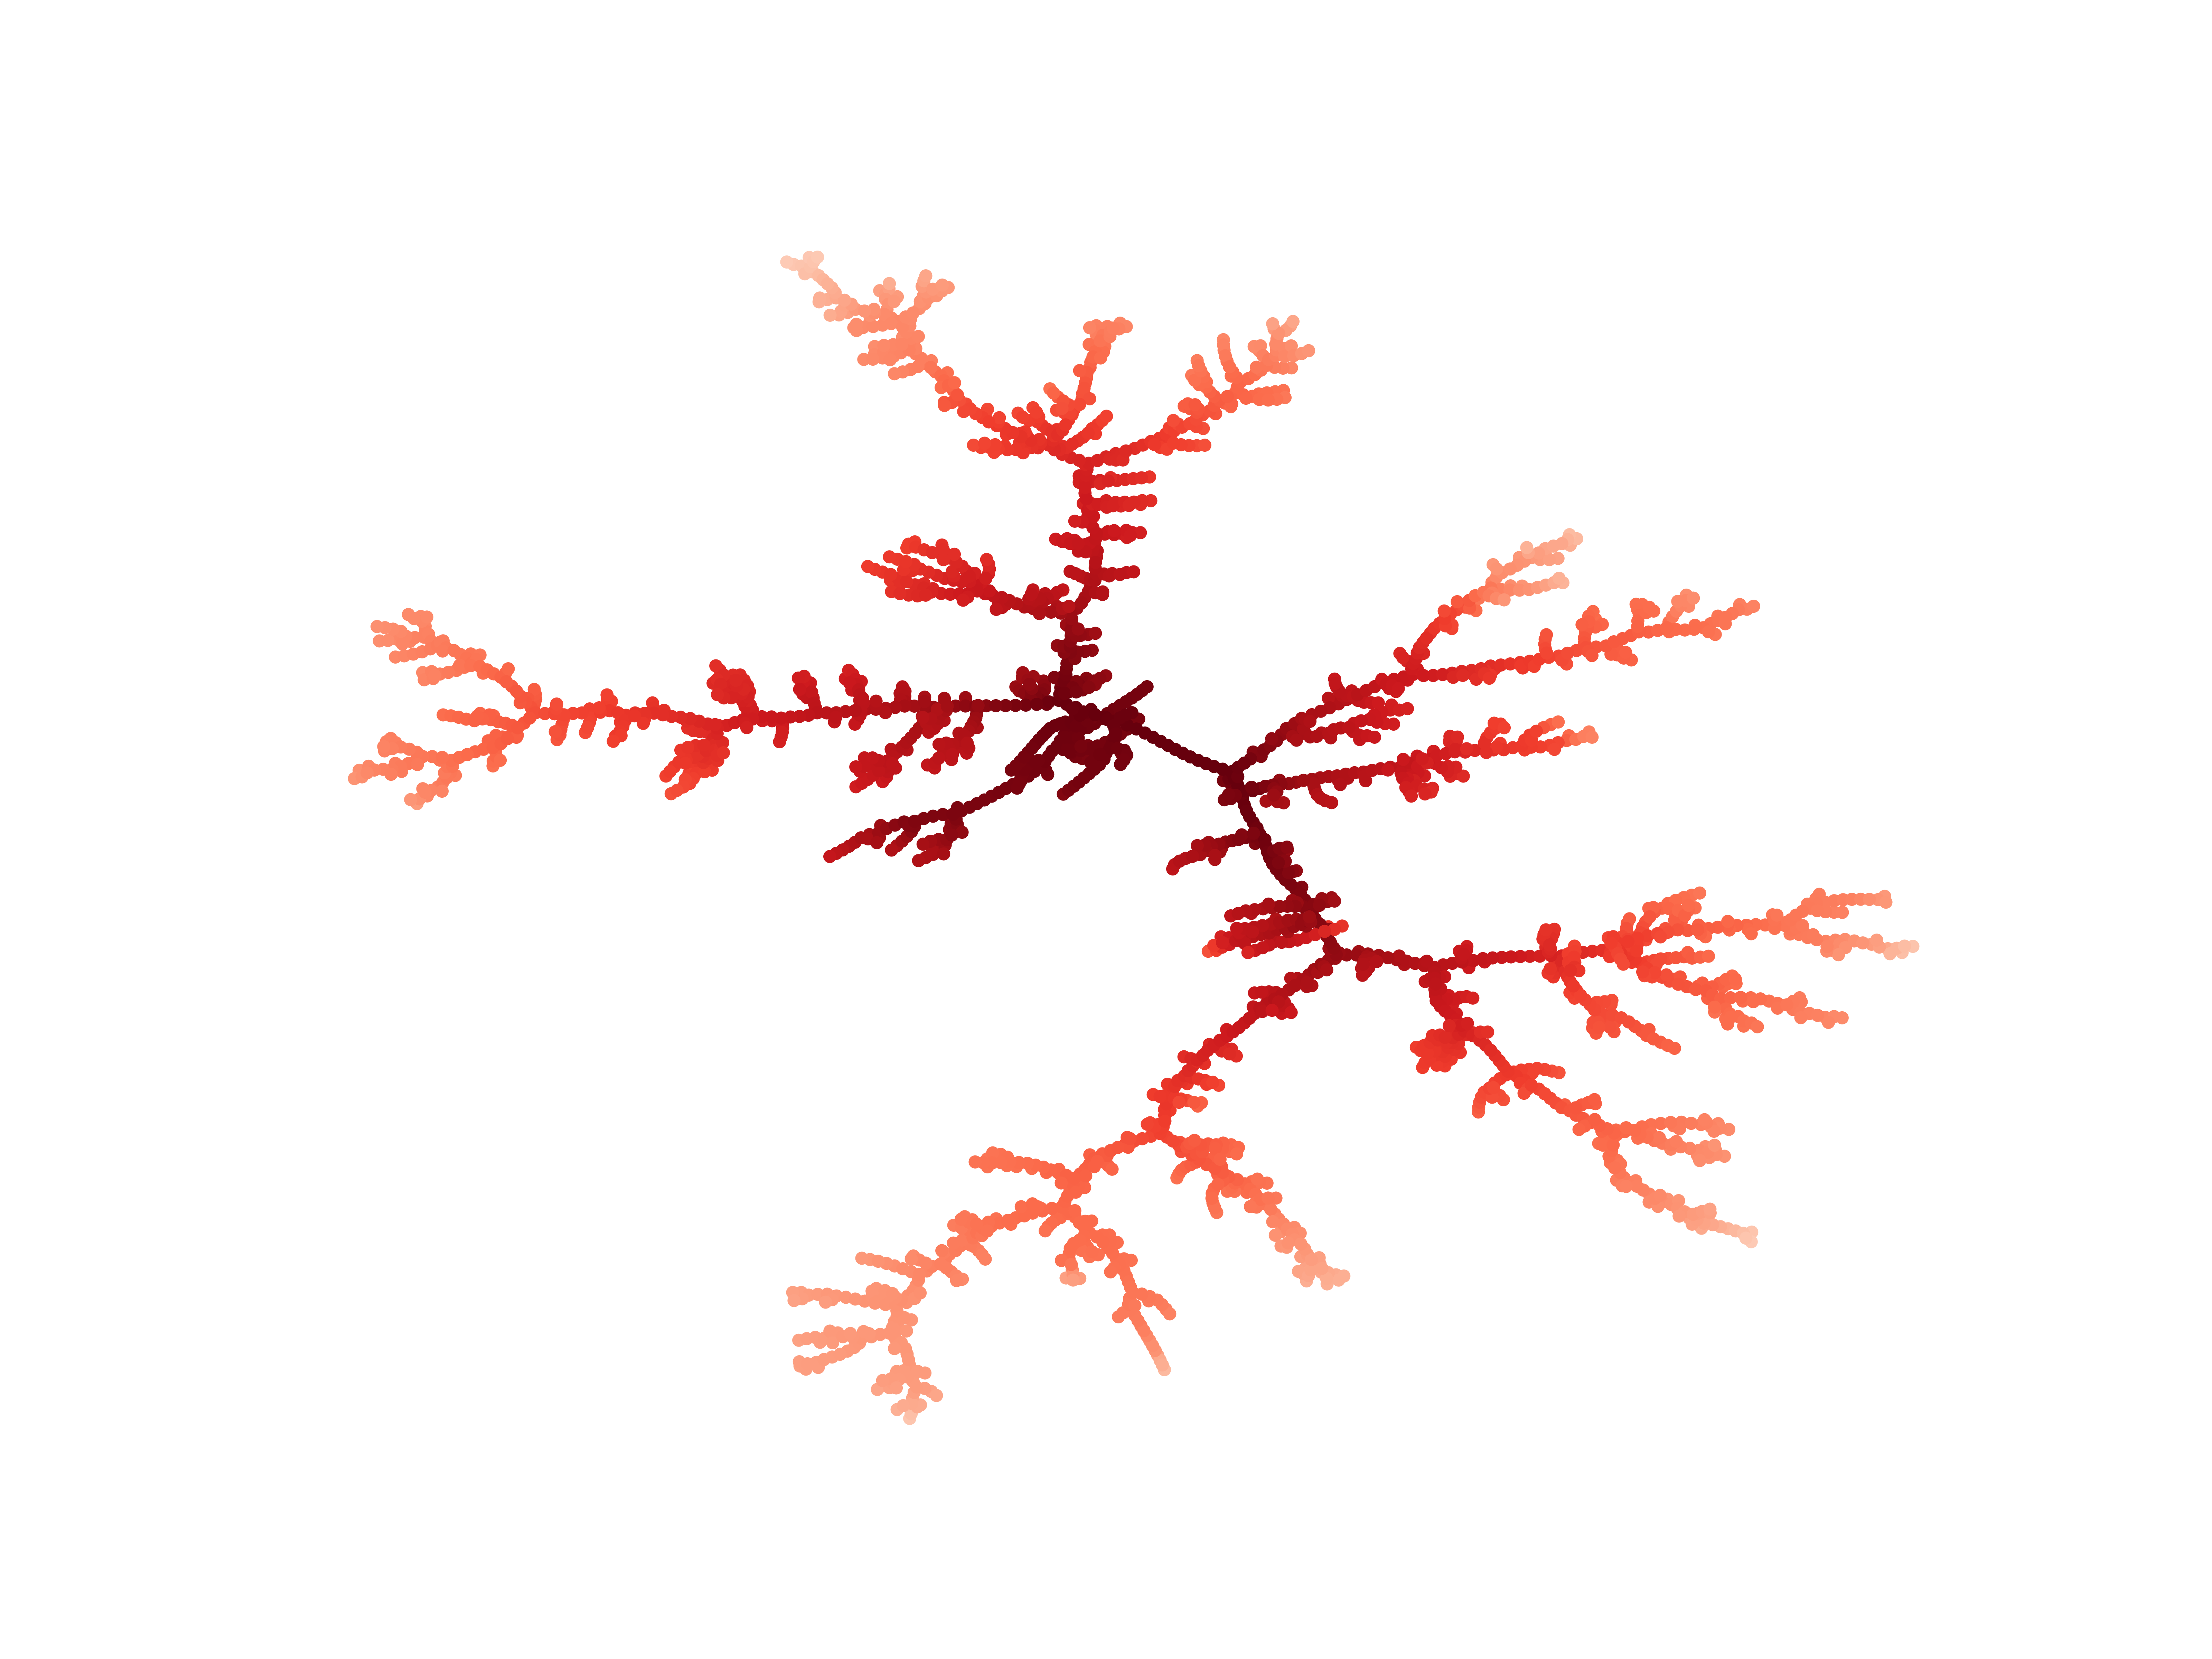
This project is about Graph Sampling from distance matrices using different Spanning Trees(minimum spanning tree, maximum spanning tree and random walk spanning trees including: low weighted and high weighted random walk spanning trees) and visualization of average shortest path, closeness centrality and betweenness centrality in these graphs.
The project was developed using some python libraries such as networkx, numpy and graphviz.
The main purpose of graph sampling is to construct a representative smaller sub graph from a very large graph. A representative sample is one which preserves important properties of the large graph. Graph Sampling becomes more important when the original Graph is massive.
Ideally since our sample is similar to the large graph, instead of using the large graph to calculate relevant features, we can use our sample so that it takes less time due to having fewer edges and possibly nodes.
There is no perfect sample that can preserve all the properties of the original graph, so we should find the most appropriate one that can preserve the important properties for domain-specific goals.
Back to the main page